UML State Diagrams
In previous chapter we learned about how use case can be defined using UML Activity Diagrams. This chapter explains how you can define use case using UML State Diagrams.
State Diagrams
Unlike UML Activity Diagram, where the central focus is on activities, UML State Diagrams focuses on transitions between use case states.
The following diagram defines the “Person Identification” use case of the dental office information system:
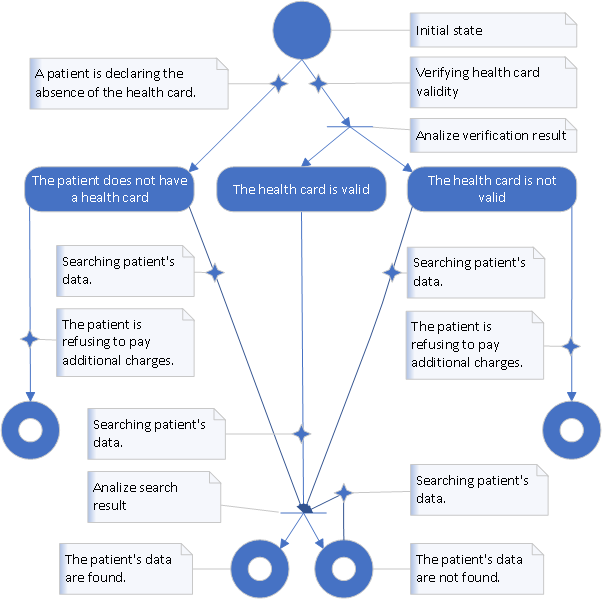
So far, we have only seen diagrams with initial and final states. The above diagram introduces us to the intermediate states. Intermediate states are indicated by rounded rectangles.
The initial or intermediate state reflects the waiting status of a business process or sub-process , where nothing happens until a trigger starts a transition.
For example, “Person Identification” sub-process defined by the diagram above remains in its initial state until one of the triggers starts “A patient is declaring the absence of the health card” transition or another trigger starts “Verifying health card validity” transition.
The same sub-process stays in its “The patient does not have a health card” state until one of the triggers starts “The patient is refusing to pay additional charges” transition or another trigger starts “Searching patient’s data” transition.
Usually, triggers are not shown on UML State Diagrams and transitions with the same meaning can be merged into one using junction sign. This turns the above diagram into this:
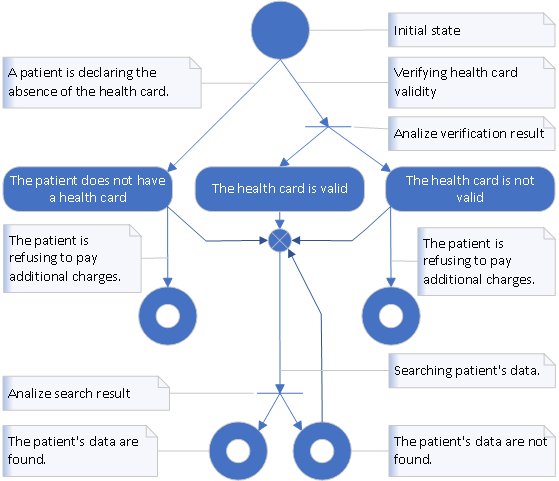
As we learned earlier, a set of activities performed according to established rules transfers a sub-process from the current state into one of the target states. That is, we can say that a transition represents a set of activities performed according to established rules that transfers a sub-process from the current state into one of the target states .
The rules are indicated by a fork transition, which can terminate in one of the target states . For example, the transition “Verifying health card validity” may end in the state “The health card is valid” or in the state “The health card is not valid” according to the rule “Analize verification result”.
Table of Content Introduction into Business Process Previous: Business Subprocess Modeling Next: Finite State Machine